
NBA Pace and Totals: Using Possessions to Bet Over/Unders
 Available in US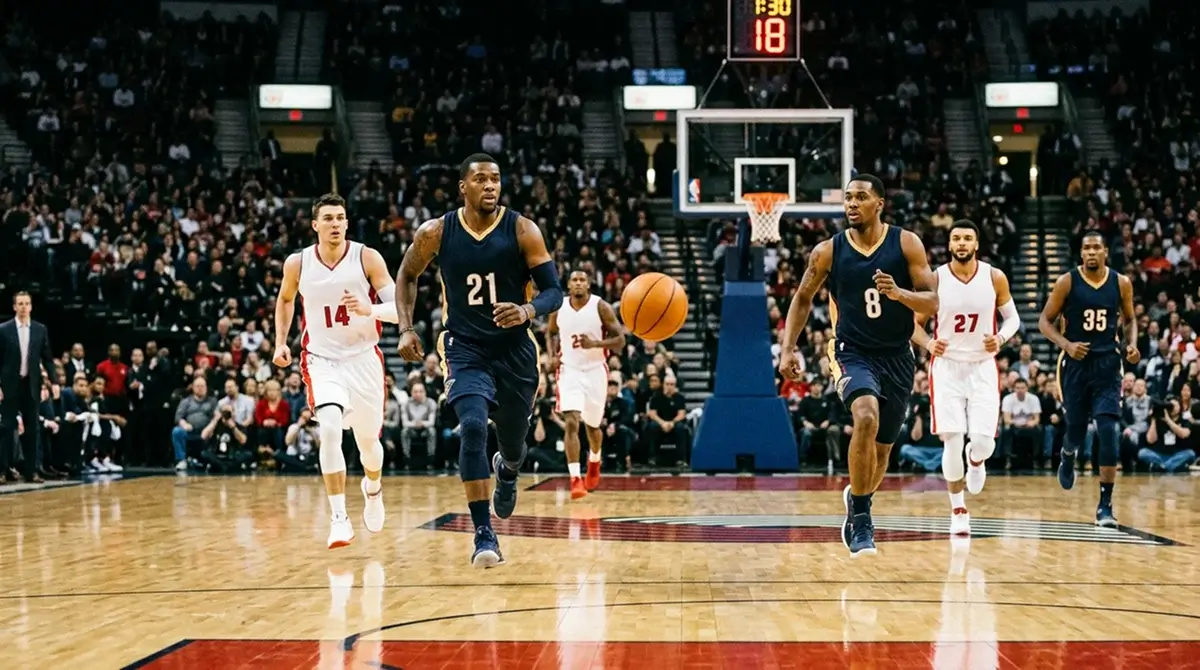
The first time I watched a totals line shift two points on a Tuesday afternoon for no obvious reason, I assumed I had missed an injury report. I had not. What I had missed was a quiet pace adjustment from the bookmaker model, made because the early-season trend data had updated with two more games of the visiting team’s accelerated rhythm. Two points on a 228 total is the difference between a sharp bet and a sucker bet, and pace is what moves it.
This piece is the working version of the conversation I have with anyone serious about totals: how possessions actually drive the over/under, why the 2025/26 NBA season is the strangest pace environment in three decades of records, and how to use that read on a UK slip without overcomplicating the model.
Pace, Possessions, and the 48-Minute Match
The clearest definition I have for pace is also the most boring: pace is the number of possessions a team uses per 48 minutes. That’s it. Strip every metaphor and every analyst’s flourish from the term, and you are left with possessions per game, normalised to a full game’s worth of minutes so you can compare a team that plays a lot of overtime against a team that does not.
What matters is the implication. A possession is the unit in which scoring happens. If two teams average 100 possessions per 48 minutes between them, and league average offensive efficiency is 114.3 points per 100 possessions, the underlying expected total is around 228 points. If those same two teams average 105 possessions, the expected total at the same efficiency is around 240. That 12-point swing is enormous on a totals line, and it is driven entirely by possession volume.
The 2025/26 season opened with league-wide pace at 101.9 possessions per 48 minutes – the highest reading recorded since modern play-by-play data began 30 years ago. Average score per team in the first 10 days hit 117.7 points per game, the third-highest reading in NBA history and the highest in 64 seasons. Those two numbers are the same story told twice: possessions are up, the points are up, and the totals lines have to chase.
The bettor who internalises possessions as the underlying unit, rather than scoring as a black box, has the right framing for every totals decision that follows. Everything from here is variations on that theme.
Why Pace Alone Doesn’t Set the Total
If pace alone set the total, we would have a one-variable forecasting problem and no edge would exist. The reality is that the over/under is the product of two numbers: pace and efficiency. Pace tells you how many possessions there will be. Efficiency tells you how many points each side scores per 100 of those possessions. Multiply them together, and the expected total falls out.
Efficiency is the variable everyone underweights. A team can play 105 possessions and score 95 points per 100 because they are inefficient – turnovers, rushed shots, poor shot selection – and the high-pace assumption fails. A team can play 95 possessions and score 120 points per 100 because they take the right shots and make them, and the low-pace assumption fails the other way.
The model that matters is pace × efficiency for both sides. For a totals projection, you want the average of the two teams’ pace estimates (because in any given game, both teams use the same number of possessions), multiplied by the average of their adjusted efficiency numbers. If both teams play at 102 possessions per 48 and the combined offensive efficiency against each other’s defensive rating projects to 113 points per 100, the expected total is roughly 102 × 1.13 × 2, or around 230.5 points.
That projection is the starting point, not the answer. From there you adjust for venue, rest, injury reports – particularly given the new 15-minute injury reporting cadence introduced from 22 December 2025 – and the specific matchup tilts that pace and efficiency averages cannot capture. But starting from pace × efficiency rather than from raw points-per-game history is the difference between projecting a total and remembering one.
The Record 2025/26 Pace Reading
The 101.9 pace number is the headline of the early-season story, but the reasons matter more than the number itself. The NBA’s offensive efficiency reading of 114.3 points per 100 possessions sits within fractions of the all-time record (114.5, set two seasons ago), which means scoring is at a near-historic peak before the pace lift even applies. Stack pace 101.9 on top of efficiency 114.3, and you get the highest scoring environment the league has ever played in.
Some of this is rule-driven. Coaches have leaned into faster transition offence and earlier shot clocks. Some of it is roster-driven. The modern wing can shoot from anywhere on the floor, which forces defences to extend further from the rim, which opens transition lanes that did not exist a decade ago. Some of it is fatigue-driven, paradoxically – when defences cannot reset before the next possession starts, they give up easier looks, which feeds the efficiency number.
For the totals bettor, the practical implication is that 230-point totals are now the median, not the ceiling. The market has caught up to most of this, but not all of it. Where I still find edge is in pace-mismatch games – a fast team facing a deliberately slow team. The market often projects pace as a simple average of the two team pace numbers, but in reality the faster team frequently dictates pace by forcing transition opportunities the slow team cannot opt out of. Lean into those games as totals overs more often than the line implies.
Team Pace Tiers and How They Drift
I sort teams into three tiers for pace projection. Top tier – running teams whose pace number sits comfortably above the league average. Middle tier – pace-neutral teams whose number hovers within a possession of the league average. Bottom tier – deliberate teams whose pace number sits two or more possessions below the league average.
The trap is treating those tiers as static. Pace drifts through a season for reasons that are not always obvious. A new coach changes the pace profile. A roster trade – particularly one involving a primary ball-handler – changes pace because the new starter operates at a different tempo. An injury to a key tempo-setter, like a high-usage point guard, slows the team for as long as he is out.
The 2025 trade deadline shifted three or four teams’ pace profiles by full possessions per 48 minutes – a substantial change for a totals projection. The bettor who updated his tiers immediately after the deadline beat the totals lines for two weeks before the market caught up. The bettor who relied on pre-deadline tiers underperformed by the same margin.
The discipline is to refresh your tiers every two to three weeks during the regular season, and immediately after any meaningful roster change. Pace numbers are not opinions; they are calculations, and they update with the data. A bettor whose mental model of team pace is six weeks old is a bettor handing edge to the market.
Live-Game Pace Signals to Watch
The live totals market is where pace reads pay best, because pace becomes visible inside the first quarter. By the end of the first 12 minutes, you can see whether the projected pace is being met, exceeded, or undercut, and the live total adjusts accordingly. The bettor who is watching the actual flow of the game, rather than the score widget, sees these adjustments before they fully register on the line.
The signal I look for first is fast-break frequency. If both teams are pushing the ball in transition off makes as well as misses, pace is running hot, and the live total will drift upward. If both teams are walking the ball into the half-court, pace is running cold, and the under starts to look interesting at numbers the pre-game model would not have priced. Stats Perform’s Andrew Skweres has noted that “a sportsbook saw a 1.3× increase in bet count and double the average stake size after they included a contextual stat next to markets” – what that finding really shows is how much demand exists for live signals that the casual bettor cannot read for himself.
The second signal is foul rate. A high-foul first quarter – say 14 or more combined fouls – slows the game in absolute terms because free throws use clock without scaling possessions linearly. A low-foul first quarter accelerates pace and supports overs. Neither is dispositive on its own, but stack them on a live read and the totals decision becomes much more confident than the static pre-game projection allowed.
The third is shot quality, which is harder to read at home but trackable through made-shot location data on most live broadcast feeds. A game where both teams are generating clean three-point looks and rim attempts is a game where efficiency holds up to the projection. A game where the offence is bogged down into mid-range fadeaways is a game where efficiency lags and the under becomes the bet, regardless of how the pace is running.
Pace is not a destination – it is a lens. Every total you see on the board is a pace assumption multiplied by an efficiency assumption, and the bettor who can read both lenses cleanly will find more edge than the bettor who treats the over/under as a single number to be tested. If you want to widen the lens further, the natural next step is reading the underlying efficiency metrics directly, which I have written about in my breakdown of ORTG, DRTG and eFG% in practice.
FAQ
What is a ‘fast’ NBA pace number in 2025/26?
The league average sits at 101.9 possessions per 48 minutes, the highest reading on record. A ‘fast’ team in this environment runs at roughly 104 or above, while a ‘slow’ team sits around 99 or below. Anything within a possession of league average is essentially pace-neutral, and the practical implications for a totals projection are minimal at that range.
Does pace matter more for totals or for player props?
Pace is the more direct driver of totals because the over/under is essentially possessions multiplied by efficiency, doubled. For player props, pace matters as a multiplier on individual usage and rebound rates, but it interacts with positional and role variables that often dominate the pace effect. For totals, pace is variable one. For props, pace is variable three or four.
Published by the bet of the day nba team.